Sales Pattern Reports
Sales Pattern Reports
Analyze sales trends and patterns to make better business decisions.
Overview
Sales Pattern Reports help you understand how your sales behave over time.
They provide insights into:
- Sales trends
- Seasonal demand
- Product performance
- Customer buying patterns
Why Use Sales Pattern Reports?
These reports help you:
- Identify peak sales periods
- Forecast demand
- Plan inventory
- Improve sales strategy
Key Insights
Sales Trends
Track how sales change over time:
- Daily
- Weekly
- Monthly
Seasonal Patterns
Identify seasonal demand:
- High sales periods
- Low sales periods
Example:
- Festive season → higher sales
- Off-season → lower sales
Item-wise Trends
Analyze which products:
- Sell frequently
- Have increasing demand
- Are slow-moving
Customer Buying Patterns
Understand:
- Repeat customers
- Order frequency
- Average order size
Data Sources
Sales pattern reports use data from:
- Sales Orders
- Sales Invoices
- Delivery Notes
How to View Sales Patterns
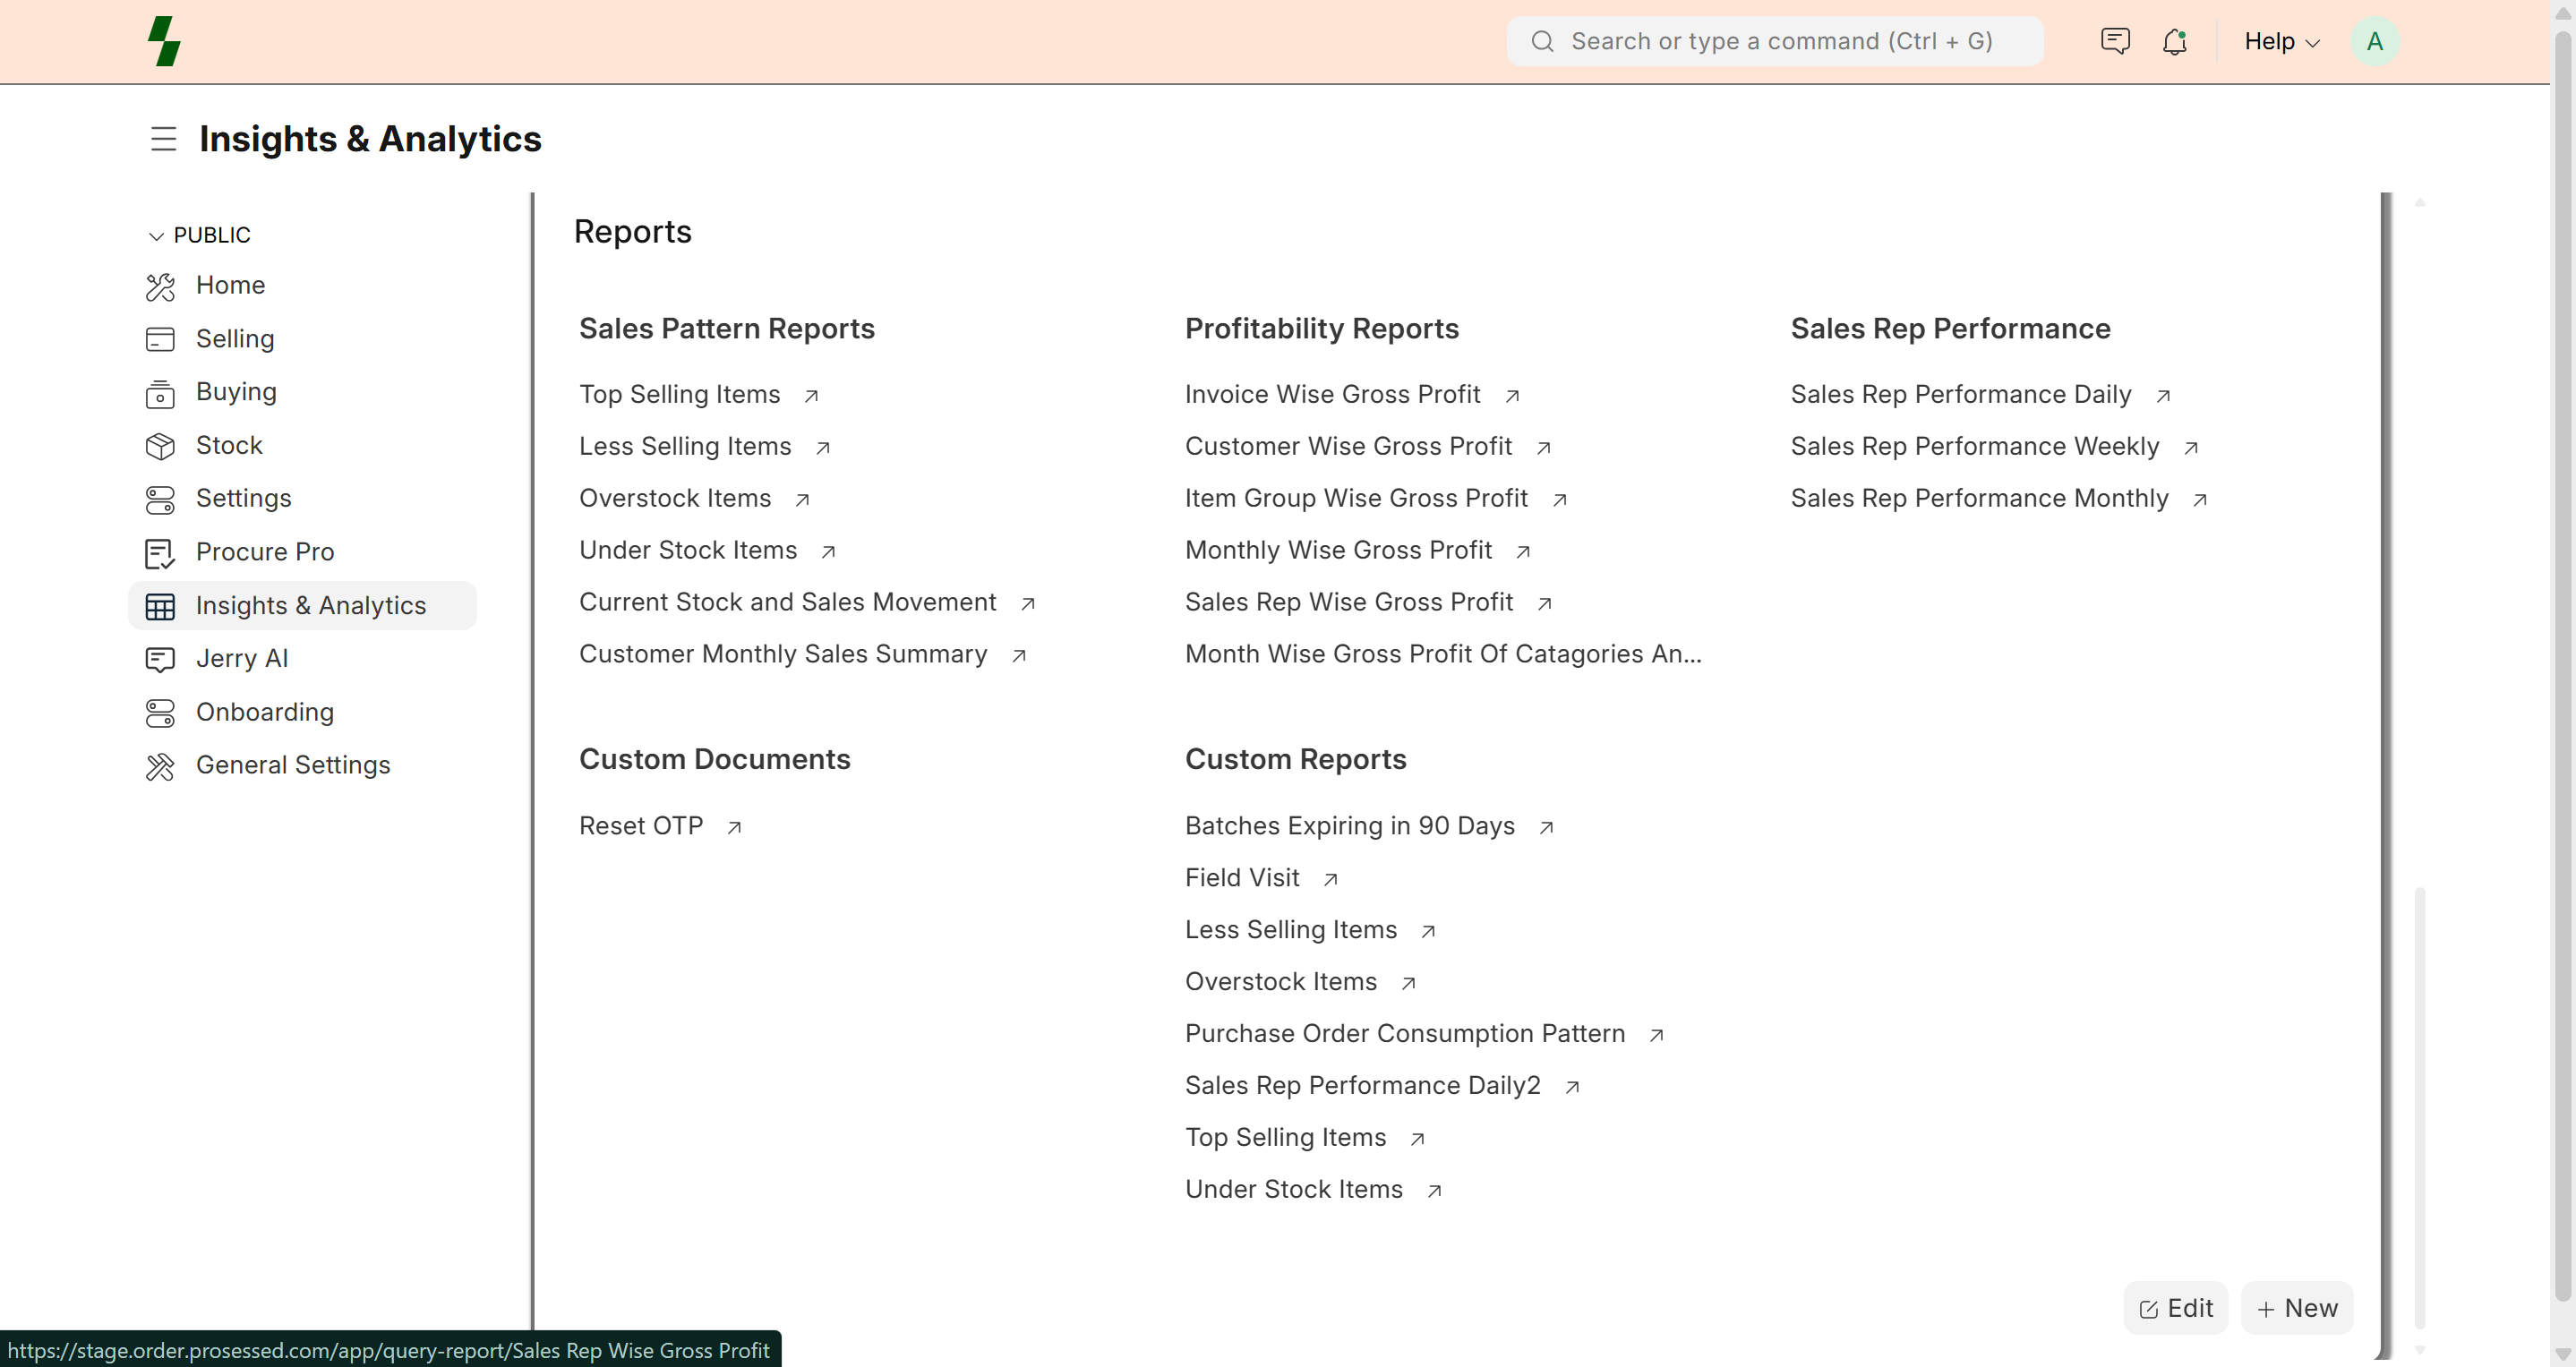
Go to Insights & Analytics
- Select reports like:
- Top Selling Items
- Less Selling Items
- Apply filters:
- Date range
- Item / Customer
- Sales person
Example
Monthly Sales Trend
| Month | Sales |
|------|------|
| Jan | $10,000 |
| Feb | $12,000 |
| Mar | $15,000 |
👉 Increasing trend indicates growth
Key Metrics
- Total sales
- Order count
- Average order value
- Growth rate
Use Cases
- Forecast inventory needs
- Plan promotions
- Identify best-selling products
- Optimize pricing strategies
Best Practices
- Analyze trends regularly
- Compare periods (month vs month)
- Focus on high-demand items
- Adjust stock based on trends
Common Issues
- Inconsistent data → Check missing entries
- Incorrect trends → Verify filters
- Low visibility → Use correct reports
Why It Matters
Sales pattern analysis helps you:
- Improve planning
- Increase revenue
- Reduce inventory risks
Last updated 2 months ago